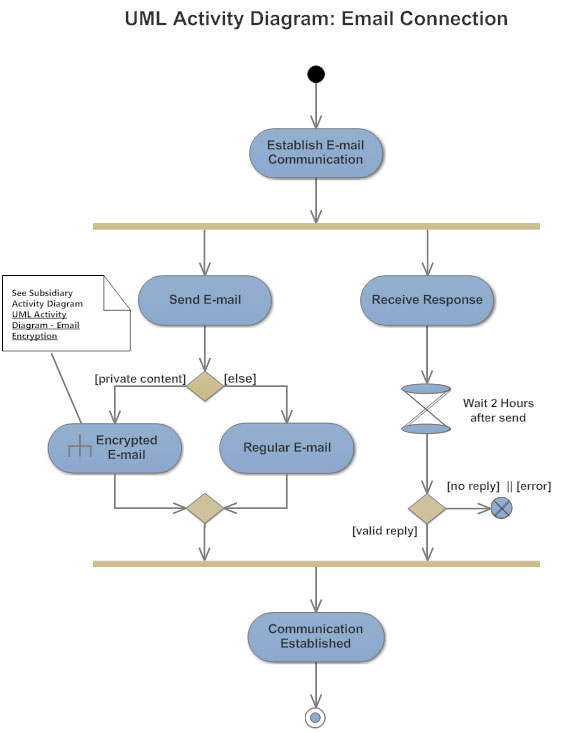
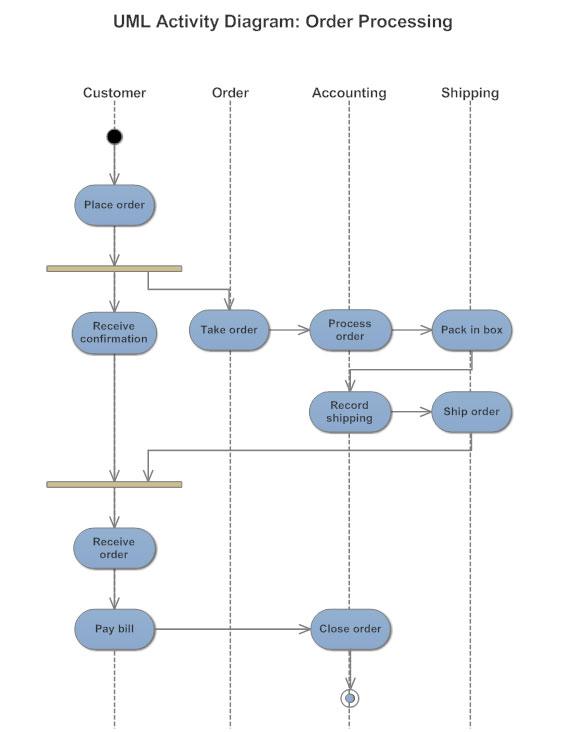
What is an Activity Diagram?
An activity diagram visually presents a series of actions or flow of control in a system similar to a flowchart or a data flow diagram. Activity diagrams are often used in business process modeling. They can also describe the steps in a use case diagram. Activities modeled can be sequential and concurrent. In both cases an activity diagram will have a beginning and an
Basic Activity Diagram Notations and Symbols
Initial State or Start Point
A small filled circle followed by an arrow represents the initial action state or the start point for any activity diagram. For activity diagram using swimlanes, make sure the start point is placed in the top left corner of the first column.

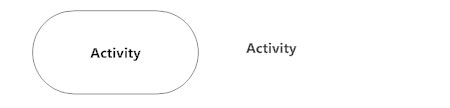
Activity or Action State
An action state represents the non-interruptible action of objects. You can draw an action state in SmartDraw using a rectangle with rounded corners.
Action Flow
Action flows, also called edges and paths, illustrate the transitions from one action state to another. They are usually drawn with an arrowed line.

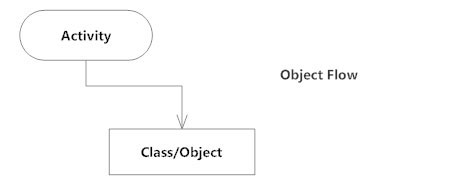
Object Flow
Object flow refers to the creation and modification of objects by activities. An object flow arrow from an action to an object means that the action creates or influences the object. An object flow arrow from an object to an action indicates that the action state uses the object.
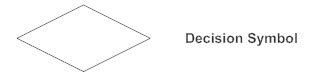
Decisions and Branching
A diamond represents a decision with alternate paths. When an activity requires a decision prior to moving on to the next activity, add a diamond between the two activities. The outgoing alternates should be labeled with a condition or guard expression. You can also label one of the paths "else."
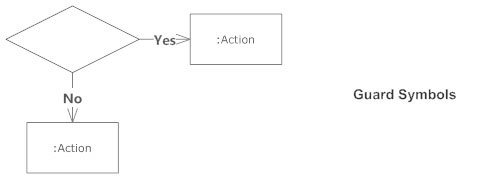
Guards
In UML, guards are a statement written next to a decision diamond that must be true before moving next to the next activity. These are not essential, but are useful when a specific answer, such as "Yes, three labels are printed," is needed before moving forward.
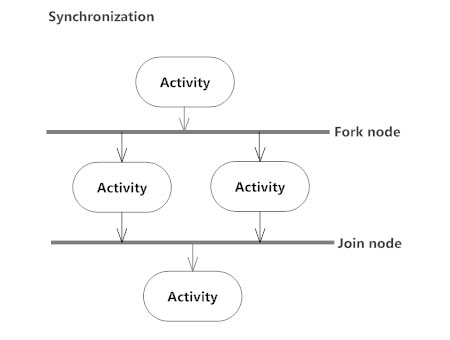
Synchronization
A fork node is used to split a single incoming flow into multiple concurrent flows. It is represented as a straight, slightly thicker line in an activity diagram.
A join node joins multiple concurrent flows back into a single outgoing flow.
A fork and join mode used together are often referred to as synchronization.
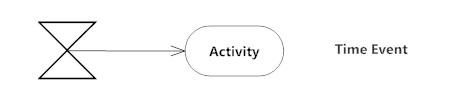
Time Event
This refers to an event that stops the flow for a time; an hourglass depicts it.
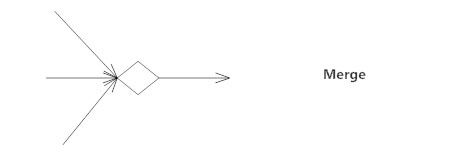
Merge Event
A merge event brings together multiple flows that are not concurrent.
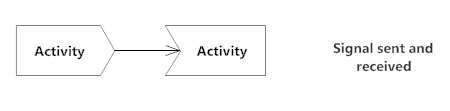
Sent and Received Signals
Signals represent how activities can be modified from outside the system. They usually appear in pairs of sent and received signals, because the state can't change until a response is received, much like synchronous messages in a sequence diagram. For example, an authorization of payment is needed before an order can be completed.
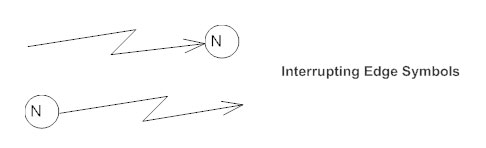
Interrupting Edge
An event, such as a cancellation, that interrupts the flow denoted with a lightning bolt.
Swimlanes
Swimlanes group related activities into one column.
Final State or End Point
An arrow pointing to a filled circle nested inside another circle represents the final action state.

Comments
Post a Comment